Showing posts with label Statistics. Show all posts

Tuesday, August 15, 2023

(x, why?) Mini: Box Plot

(Click on the comic if you can't see the full image.)
(C)Copyright 2023, C. Burke. "AnthroNumerics" is a trademark of Christopher J. Burke and (x, why?).

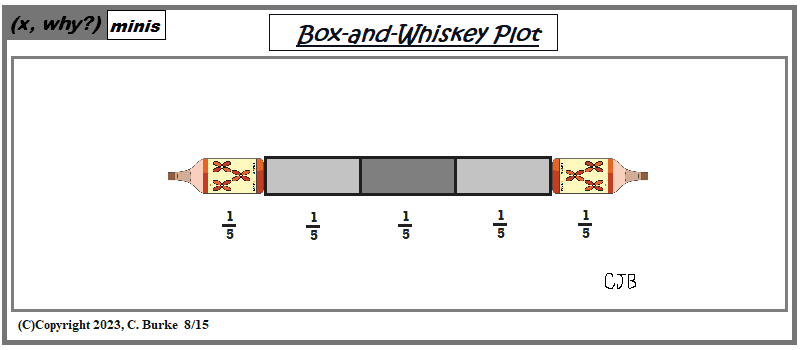
That'd be a gallon of data.

This could be a valid chart, if someone had a use for it. You'd need a Six-Number Summary based on quintiles, instead of quartiles. If someone wanted just the 10% above and below the median, that would be the middle box. If for some reason, you wanted the central 60% instead of 50%, that would be the entire box containing the three smaller boxes.

And if anyone is looking for outliers, have a dram at the bar.

As for as the whiskey bottles go, the labels apper to be three flowers or butterflies or possibly an ancient family crest. That's my story and I'm sticking to it.

Cheers!


I also write Fiction!


You can now order Devilish And Divine, edited by John L. French and Danielle Ackley-McPhail, which contains (among many, many others) three stories by me, Christopher J. Burke about those above us and from down below.
Order the softcover or ebook at Amazon.

Also, check out In A Flash 2020, by Christopher J. Burke for 20 great flash fiction stories, perfectly sized for your train rides.
Available in softcover or ebook at Amazon.

If you enjoy it, please consider leaving a rating or review on Amazon or on Good Reads.


Come back often for more funny math and geeky comics.


Thursday, May 20, 2021

Belle & Mr. Whiskers: Skew

(Click on the comic if you can't see the full image.)
(C)Copyright 2021, C. Burke. "AnthroNumerics" is a trademark of Christopher J. Burke and (x, why?).

It's just the mean to the left, and a shift to the right.

Either way, Mr. Whiskers is not amused. He's a grumpy boxplot. (You know, I have to see when that other grumpy cat first appeared.)


I also write Fiction!


Check out In A Flash 2020, by Christopher J. Burke for 20 great flash fiction stories, perfectly sized for your train rides.
Available in softcover or ebook at Amazon.

If you enjoy it, please consider leaving a rating or review on Amazon or on Good Reads.

Thank you.


Come back often for more funny math and geeky comics.


Monday, February 12, 2018

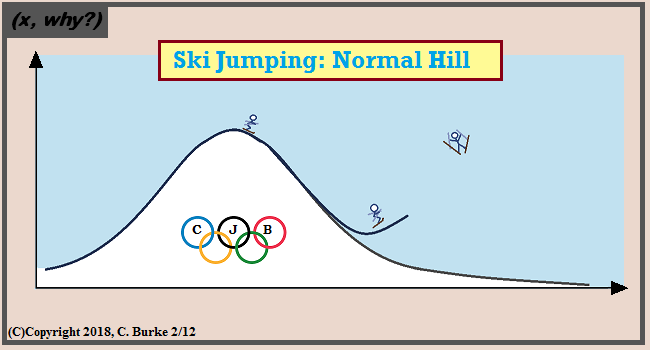
Olympic Ski Jumping: Normal Hill

(Click on the comic if you can't see the full image.)

(C)Copyright 2018, C. Burke.

Really ... there's nothing 'normal' about this. Cue 'Goofy voice': Ya-hoo-hoo-hooey!!!


Come back often for more funny math and geeky comics.


Tuesday, May 17, 2016

Daily Regents: Box-and-Whisker Plot

I'll be reviewing a New York State Regents Exam Question every day from now until the Regents exams begin next month. At least, that is the plan.

June 2014, Questions 32

32. Robin collected data on the number of hours she watched television on Sunday through Thursday nights for a period of 3 weeks. The data are shown in the table below.
Using an appropriate scale on the number line below, construct a box plot for the 15 values.

You have two choices.

First, you can put the data into order and then find the Five-Number Summary: the minimum, Q1, median, Q3, and maximum.

The numbers in order are: 1. 1.5, 1.5, 2, 2, 2.5, 2.5, 3, 3, 3, 3.5, 4, 4, 4.5, 5.
The median is the middle number. There are 15 numbers and the 8th is the middle. That is 3
Q1 is the middle of the lower seven numbers. The 4th number is 2.
Q3 is the middle of the upper seven numbers. The 11th number is 4.
The minimum is the 1st (lowest) number, 1. The maximum is the last (highest) number, 5.

So the Five-Number Summary, and the numbers that will be used to make the Box-and-Whisker Plot, are 1, 2, 3, 4, and 5. (Note: It will NOT always work out so nicely.)

Make a scale on the number line. There is enough room to number it from 0 to 5, counting by 1/2. (That is, every two spaces is 1.) You could use a scale of 1, if you like, but your graph will be smaller than mine. That's okay.

Put a point above each number in our Five-Number Summary: 1, 2, 3, 4, 5.
Draw a box around the middle three with a line through the median.
Draw whiskers connecting the first two points and the last two points.
You're done.

The second method is to use the Graphing Calculator. Take a look at the 10 figures in the diagram below. Don't let the 10 screens frighten you.

If you use this method, make sure you copy some of the information onto the test so you will get points for showing work. In particular, the Five-Number Summary would be good.

To use the calculator, press the STAT key. You should see Figure 1. You need to EDIT a List -- fill it with the data that you will be using. Press (1). Figure 2 shows some of the data that was entered into the first list, L1. Enter all 15 numbers. Now you are ready to plot you graph.

Press STAT again. When you get the menu, hit the right arrow to get to the CALC menu. See 1-Var Stats? That's what we want: 1 variable statistics. Press Enter twice.

You will get a scrollable screen of information. Scroll down to see the Five-Number Summary (Figure 6).

Press 2nd and Y= to get to the STAT PLOT screen (Figure 7) and press ENTER to bring you to the Plot page (Figure 8). Make sure that ON is highlighted, and arrow over to the icon that looks like a box-and-whisker plot and press ENTER.

If you press Graph, your graph won't appear because the window is formatted from -10 to 10 on the x-axis. You need to adjust this. Press ZOOM and then press 9: ZoomStat. Your box-and-whisker plot will appear. Put the graph on the paper, using the points that the 1-Var Stats function gave you.

Any questions?


If anyone in Brooklyn is looking for an Algebra or Geometry Regents Prep tutor, send me a note. I have a couple of weekly spots available between now and June.


Friday, February 26, 2016

(x, why?) Mini: Cheers!

(Click on the comic if you can't see the full image.)
(C)Copyright 2016, C. Burke.

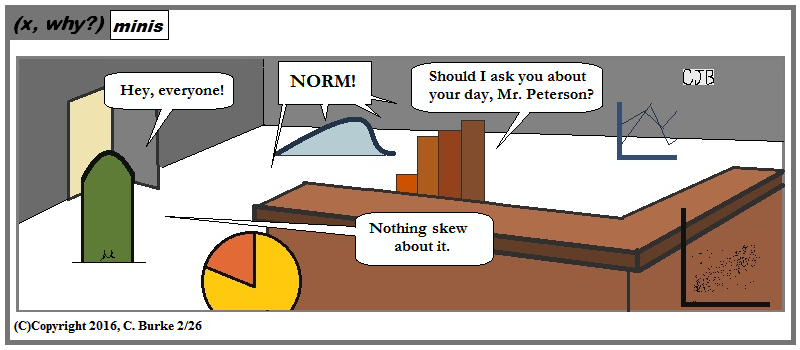
Raise a glass and talk charts and graphs!

I hate when my "quickie" comics take longer than my regular ones. I realized halfway through that I probably should have expanded it beyond the usual "mini" borders. Too late.

I don't usually go 9 days without an update. It's not for a lack of ideas, but a lack of (Time AND Energy).


Come back often for more funny math and geeky comics.


Friday, January 22, 2016

His & Hers (with Belle & Mr. Whiskers)

(Click on the comic if you can't see the full image.)
(C)Copyright 2016, C. Burke.

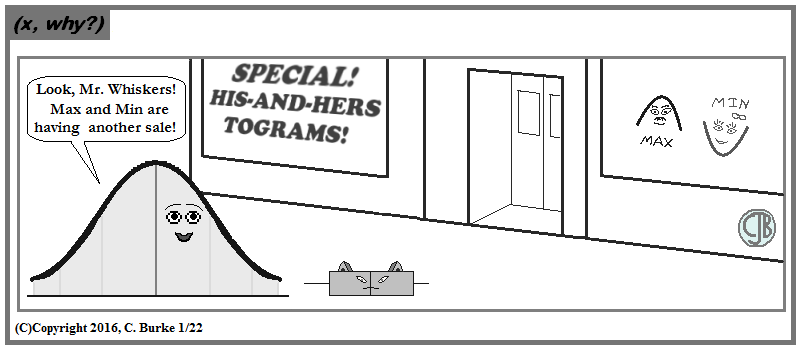
The use of herstograms has been well documented in herstory.

This is the eighth appearance for Belle & Mr. Whiskers over the years.


Come back often for more funny math and geeky comics.


Wednesday, June 10, 2015

Mean Girls (with Belle & Mr. Whiskers)

(Click on the comic if you can't see the full image.)
(C)Copyright 2015, C. Burke.

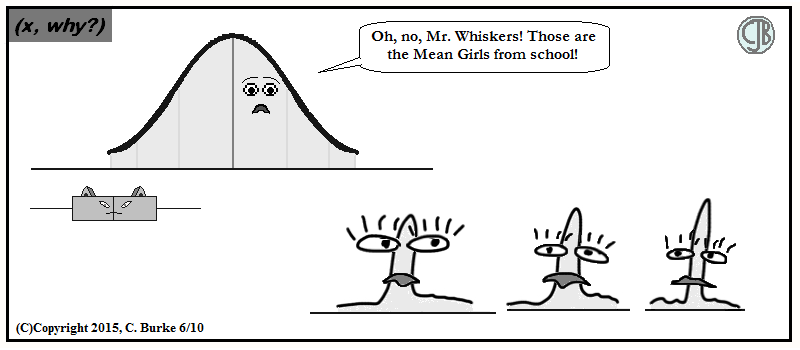
As the saying goes, they're so mean, they have no standard deviation!

This is the seventh appearance for Belle & Mr. Whiskers over the years.

Add a few more characters, and I'll have enough for a children's series ... featuring material that no one in the target demographic would understand. Sigh.


Come back often for more funny math and geeky comics.


Tuesday, December 30, 2014

Two Taylor Swifts and a Sliding Yardstick

I've come to realize that as of this month of December, I am currently exactly 2 Taylor Swifts in age. That's really not so bad when I think about it because when You Belong With Me hit the charts (in 2009), I was 2.25 Taylorswifts. So i guess it's getting better. I could continue, figure out when I'll be only 1.5 Taylorswifts, but it would start to sound like an old Abbott & Costello routine. (Not that there's anything wrong with that.)

I had the thought recently about sliding yardsticks (or sliding metrics). What if you're measuring something, and the unit that you're measuring against changes along the way. It would be a great way to obscure (or hide) data.

What brings this up, without getting political, are all the political postings I see on different social platforms by people who should be smart enough to know better. (Scary thought: they are smart enough, but they assume we're all dumb enough.)

You don't judge a book by its cover and you don't evaluate major chunks of the economy based on a graphic containing a pithy quote and carefully selected factoids(*) underlined with a "witty" applause line, wrapped up in 140 characters, meant to be repeated and reported by people using the phrase "Alls I knows is...".

(*) factoid - Not a "little fact", but something that "looks like a fact", but isn't. This could be extended to the presentation of facts in a way that they seem related but are really not.

If that's all you know, you need to be more educated. Look beyond the numbers. Check those that confirm your biases and those you dismiss out of hand as made-up lies (What other kind are there?). However, when the fact-checking doesn't happen, a low-information individual is created -- someone who doesn't know all the facts, who knows that they don't have all the facts, but believes that every fact and factoid that they do have is enough, and no other piece could possibly make a difference. Any other data is obviously wrong, and if not, needs to be ignored, you Fill-In-The-Blank-ist Bad-Noun!

Oddly, though no piece of information can sway them, they are shocked that their one piece of information hasn't yet swayed you.

What spurs this on?

Comparisons of budgets and deficits and debts and prices and any number than can (and did) fluctuate wildly, so that specific highs and lows can be picked out and averaged or compared or manipulated alongside the assignment of blame or credit, regardless of the merit of that assignment. Is the latest increase big or tiny? Is it bigger or tinier than that other guy's? And what percent increase in the load was the straw that broke the camel's back?

Are these things appropriate fodder for debate? Absolutely, as long as that debate is longer than a sentence and the rebuttal is more than "You're a butthead. Neener. Neener!"

Shouting down your opponent doesn't mean you've won the argument. It means you're rude and willing to stay ignorant of facts you don't have.

My entire class can ignore me when I say that 0! = 1. They can all insist that it should be 0, and maybe even argue why. but they'll be wrong in class and wrong on every test after.

As for me, I've given way too much thought to it. I'll be exactly 1.5 Taylorswifts old when (T + 25)/T = 1.5

Yes, I can calculate it. No, I don't want to. Unlike Costello, I know that she isn't going to catch me. The answer is that the ratio is getting smaller, but I'm still getting old.

Sunday, December 28, 2014

Disposition of Gift Cards

(Click on the comic if you can't see the full image.)
(C)Copyright 2014, C. Burke.

There could even now be a gift card in my wallet waiting to be used ... or expired.

Sadly, many do get stolen with handbags, or hacked online. One of the reasons I have old iTunes cards unused is that the very first one I cashed in (for my child) was immediately hacked and spent and an additional $50 was run-up on my credit card. The iTunes card was a total loss because we just couldn't find a human being at Apple to talk to. The credit card was easier to deal with.

That being said, when I can buy anything, I never know what it is I want to buy. If it's just a store card where I'll eventually shop anyway, that isn't so bad. But, as noted in the comic, I'm just as likely to be shopping for a present for someone else, or for run-of-the-mill, day-to-day junk that I need, and not anything special or gift-like in nature.

Caffeine, on the other hand, while being day-to-day, every day, is always a special gift! I'm set for the next month.


Saturday, December 06, 2014

Blog: How Do We Make a Scatterplot?

I was going through a shoebox of stuff in my basement. I found a handful of paperbacks I'd started, some old stubs and statements and, underneath all that, some pages ripped from both spiral and composition notebooks. Most of them appeared to be random questions and answers to homework assignments from April, 2012 (not too bad), but with them was a lesson plan dated December 8, 2004, almost exactly 10 years ago. It was my first year teaching high school, and only my second full year teaching. I remember the students enjoyed the activity, but in my morning class and my afternoon class. However, I don't think I ever did it again. A few reasons I can think of -- I spent the next few years teaching Geometry, teaching Special Ed, and switching gears from Math A to Integrated Algebra. Every year, it seemed, the ninth grade curriculum was being rewritten or reordered. And, frankly, some groups of students were better than other when it came to activities (try to close an activity and bring the class together for a summary without half of them packing their bags!), and some times of the year lend themselves to this sort of thing more than others.

So, basically, this is the sheet of paper I kept. I'm sharing it with you and, thus, keeping it electronically, so I can throw this scrap away.

December 8, 2004

Aim: How do we make a scatterplot?

SWBAT make a graph comparing numbers of words spoken per second/minute.

Activity: Students will break into groups. Each will have a sports article. Their task is to take turns "auditioning" for a sports announcer job (like "Ron" on "G-Unit Radio")

Note: Ron was a school aide who did the morning announcements with a little bit of a flair, and he referred to it as "G-Unit Radio", the "G" for the school name and "Unit" for "Family" ... and having nothing at all to do with a similarly-named hip-hop group from Jamaica, Queens.)

Each article is marked off at 10-word intervals (for easier counting). One group member will be the timer, another the recorder. Students will take turns talking for 10, 15 20 and 30 seconds and then counting the words. After the data is recorded, data will be graphed.

Q: Is there a relationship between time and # of words?

HW: Finish the graph based on the data.
Work on December HW packet.


I remember when making groups, one of the keys decisions in grouping was how many of them had a watch. This was before everyone has a phone as well.

I also remember being told to come up with a Christmas vacation assignment. I hate those, and some of my students would be traveling (some outside the country) and did I really want them to bring books along? So I make a packet of HW for the month of December and told them it was due the day after the day we got back because everyone always forgets it the first day back. (Some of them were doing the entire packet the day we got back, which might explain we I haven't done that since.)

I hope you enjoyed my trip down memory lane. Try the activity yourself, and let me know how it works. FYI: I was in the middle of a free six-week trial subscription of Sports Illustrated, courtesy of whatever store I had started my Christmas shopping in, and I pulled an article from there. The sports pages work, too, especially if your school is listed in them!

Wednesday, November 05, 2014

Binge

(Click on the comic if you can't see the full image.)
(C)Copyright 2014, C. Burke.

If everyone waits until the end of the season to watch, will the show make it to the end of a season?


Friday, October 17, 2014

Max & Min

(Click on the comic if you can't see the full image.)
(C)Copyright 2014, C. Burke.

Some thought that they could have Max without Min, but he knew his boundaries, and Min was always there.

Belle and Mr. Whiskers have been here for a while now, too. I think that this is their sixth appearance in seven years.


Thursday, July 17, 2014

Useless Junk

(Click on the cartoon to see the full image.)
(C)Copyright 2014, C. Burke.

I just have to make sure that I don't make it on her list.


Tuesday, June 03, 2014

T-Test

(Click on the cartoon to see the full image.)
(C)Copyright 2014, C. Burke.

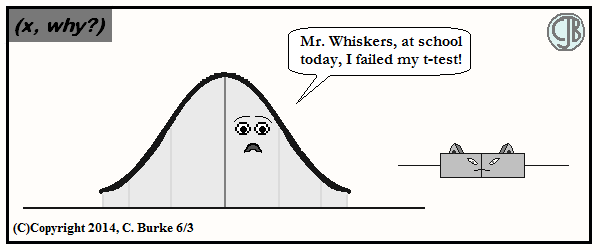
This comment is null. At least, that's the hypothesis.

The most interesting thing about the t-test was that it was created by a chemist for the Guinness brewery in Dublin in 1908.

Also interesting are the other appearances of Belle and Mr. Whiskers which happened here, here, here, and here.

That means the last one was four years ago. Should I have left them in the past?

Or call this Old Character Re-appearance Week! and ride a nostalgia train?


Tuesday, May 13, 2014

Wonder Twin Powers Activate! -- er, I mean: DiagnosticOn!

This is Day 18 of the 30-day blogging challenge, for anyone still keeping track. Like me. Or my students who want to see if I make it.

Once upon a time, I used to teach a subject called Math A. It was something that the state decided should be taught to freshmen and sophomores in high school instead of the inferior (I'm just inferring from the switch) Sequential I. Sequential I, which would be followed by II and III, just as Math A would be followed by Math B, was something that came long after I got out of high school -- I had Math 9, in eighth grade, for that matter -- and disappeared by the time I became a teacher. Math A eventually gave way to the far superior Integrated Algebra, which I say lovingly, and yet mockingly, because it's all essentially the same math! Little tweaks here and there (e.g., relative error instead of percent of error) and switching the order of the topics and the maker of the textbooks, but essentially the same.

Through it all, when it came to scatter plots, we showed them how to make a line of best fit. All we ever seemed to care about was if the line that they drew was "reasonable". There wasn't a "right" answer which we were expecting because that was something that was a little beyond them. Sometimes, we had them come up with the equation of the line of best fit, but this confused many because they had different lines, so they had different answers. Still, it was a good exercise because it reminded them how to write the equation of a line from a pair of points. It also got them used to dealing with fractions, ant that is a whole different topic altogether! ("That is a whole different topic!" they repeated in unison)

Along comes Common Core and someone realized that these kids are already using graphing calculators for their tests (which weren't allowed just a decade ago, but are now required), let's teach them how to use them. I'm all for that, except that the students never seem to have them. We can't require them to buy them (except, perhaps in specialized schools) and class sets have a habit of breaking and disappearing. When this happens, not everyone is learning how to use them and then no one can help them on test days. Now, this isn't a problem for most things -- after all, a lot of it is intuitive, and a lot of it is repeated often throughout the term, like graphing.

But then there's linear regression. That's one of the last things we teach. It doesn't get used again. I hope it's stuck in their brains instead of them stuck in the mud and left behind.

Today was the first time that I had to teach it to freshmen. I'm familiar with the process of using Lists (behind the STAT key) and calculating y=ax+b (with the use of a instead of m). That's all good. The forty-six bazillion decimals, instead of a more familiar 7/5, for example, get a discussion on proper rounding. But today was the first time that I ever had to teach about the correlation coefficient, which before now, I've really only seen in an Excel spreadsheet -- in my final grad school class. (Okay, I probably saw it sometime during a Statistics class in college, but I know that I didn't own a graphing calculator in those days. I was lucky to have a Commodore 64 with a modem at home.

Nothing on the CALC menu gave me any hints as to where I could find it, but a quick look at the Internet told me that I had the power to find it all the time. It was there in front of me. I should have found it with my brain or felt it with my heart, but I had the courage to look it up online instead.

The answer I needed will NOT show up unless you go to the CATALOG, scroll down to the middle of the letter "D" and find DiagnosticOff and DiagnosticOn. There aren't any check marks, but the thing defaults to Off. I had to instruct my students, many of whom knew little about the CATALOG in general, how to turn this on and why. They wondered why it wasn't on my default. (Okay, they didn't actually say "default", but that's what they meant!) I can understand why it defaults to radians instead of degrees, but this makes no sense to me.

The take-away from all of this is when we collect all the calculators and reset their memory, we not only have to reset each and every single calculator to Degree mode, but we'll have to go to the Catalog to turn DiagnosticOn. Twice the pain for little gain because we don't even know if they'll answer the questions, or if they'll even remember today's rather abstract lesson.

Thursday, May 01, 2014

January 2014 Algebra Regents Discussion Thread

It's Day 6 of my 30-Day blogging challenge, and I was thinking: I didn't get around to starting a discussion thread for the January Algebra Regents until long after anyone who had taken it cared any longer.

However, tutoring sessions have started and testing season is almost upon us. And I'm trolling for pings on search engines. A lot of my hits come from students looking for answers to specific questions.

So without further ado:

January 2014 Algebra Regents

1. An example of an equation is...

An equation has an equal sign. An expression does not. Only choice (4) does.

2. The greatest common factor of 3m2n + 12mn2 is

Both terms have co-efficients which are multiples of 3. Both have at least one factor of m and at least one factor of n. So the answer is (3) 3mn.

3. Jeremy is hosting a Halloween party for 80 children. He will give each child at least one candy bar. If each bag of candy contains 18 candy bars, which inequality can be used to determine how many bags, c, Jeremy will need to buy?

The number of candy bars in c bags of 18 bars is 18c. This number must be > 80. ("At least" means greater than or equal to.) The answer is (1) 18c > 80.

4. Which statement regarding biased sampling is false?

The answer is (3) "A survey handed to every third person leaving a library is biased because everyone leaving the library was not asked to participate."

When you are taking a sample, you don't want everyone to participate. By taking every third person, regardless of who that person is, bias is reduced.

(I won't go as far as to say that there is no bias, but you're doing what you can to reduce/avoid it.)

5. Which relation is not a function?

A function is not a relation if any x co-ordinate has two different values for the y co-ordinate. Choice (4) repeats x=2. If this set of points were graphed, it would fail the vertical-line test.

6. What is an equation of the line that passes through the point (-2,-8) and has a slope of 3?

Same yourself some trouble and work backward from the answers. The slope is 3, so the answer is in the form y = 3x + b. Unfortunately, all 4 choices look like this. Substitute -2 for x. Which equation gives you -8 for y? You didn't have to go far: (1) y = 3x - 2.

7. A figure consists of a square and a semicircle, as shown in the diagram below.

If the length of a side of the square is 6, what is the area of the shaded region?

The area of the entire square is 36 (which is in all four choices). The diameter of the circle is 6. The area of a semicircle is half the area of a whole circle, making it 1/2 * pi * r2. The radius is 3 (half of 6), so the area of the area of the semicircle is 9/2 * pi. The answer is (2) 36 - 4.5*pi.

8. The box-and-whisker plot shown below represents the number of magazine subscriptions sold by members of a club.

Which statistical measures do points B, D, and E represent, respectively?

A, B, C, D, and E refer to the minimum, the first quartile, the median, the third quartile, and the maximum, respectively. This is known as the Five-Number Summary.

9. What is the slope of a line represented by the equation 2y = x - 4?

Divide the entire equation by 2 to get it into slope-intercept form. The slope will be 1/2, which is what the co-efficient of x will become.

10. What is the solution of the system of equations below?

2x + 3y = 7
x + y = 3

You can work backward from the choices, which quickly eliminate choice (4) because x and y don't add up to 3. Or you can solve the system of equations. It's fairly quick and painless, so let's give it a try.

Doubling the second equation gives up 2x + 2y = 6. Subtract that from 2x + 3y = 7 and we get y = 1. That gives us choice (2) (2, 1) because we eliminated (4) already.
If you substitute y=1 in either equation, you will find that x=2.

to be continued . . .

Wednesday, April 30, 2014

Histogram

(Click on the cartoon to see the full image.)
(C)Copyright 2014, C. Burke.

This needs to be a website. Make it so.

And it's not just the people taking pictures of their lunch. It's *how many* pictures that they're taking.
Possible excuse if your Photography teacher sent you and your classmates in there, but you still look silly.


Tuesday, April 29, 2014

Day 4: Statistics Review

Note: I have a personal webpage that I use for class -- that is, I use it when I know that students are using it. I spent a good part of the evening updating the page with information about a test on Statistics that we're having on Friday. I copied over the code to the blog. No reason that it can't count toward my daily updates.

STATISTICS REVIEW

We are having an important Statistics exam on Friday, May 2, 2014.
Statistics will be an important part of the Common Core Algebra Exam.
You should review this material.

Measures of Central Tendency: The mean, median and mode. They are numbers used to describe a set of data. See the individual definitions below.

Mean: The average. To find the mean, add up all the data and divide by the number of data items there are. Example: The mean of 6, 3, 5, and 12 is (6+3+5+12)/4 = 26/4 = 6.5.

Median: The middle number when the data are in order. If the data are not in order, than the number in the ”middle” is meaningless. If there are two numbers in the middle, the median is the average of the two numbers. Example: The median of 6, 3, 5, and 12 would be found be first ordering the numbers as 3, 5, 6, 12. The numbers 5 & 6 are in the middle, so the median is 5.5.

Mode: The most frequently appearing piece of data. Unlike mean or median, there can be more than one mode. There might be no mode if no data is repeated. Mode doesn’t have to be a number: consider the data set (red, red, yellow, blue, blue, blue); “blue” is the mode. Examples: (1, 2, 3, 3, 3, 4, 4): “3” is the mode; (88, 95, 92, 95, 88): 88 and 95 are the modes; (7, 8, 9, 10): no mode.

Frequency The number of times something occurs. In the data (10, 10, 11, 11, 11, 12, 12, 13), “11” has a frequency of 3, and the total frequency of the set is 8.

FREQUENCY TABLES

A Frequency Table is a summary of the data, organized as a table. The data are on in the left column. The frequency of each piece of data is one the right.
There are three examples of frequency tables below.

In the first example, every number in the data is listed, along with its frequency. The interval of the table is 1. Because of this we can find the mean, median and the mode of the data. We can re-create the data if we wanted to by writing out all the numbers.

In the second example, the data is collected into intervals of 10. We don’t know the actual numbers; we only have approximate information. Because of this we cannot find the exact mean, median or mode. However, we can find which interval contains the median and which interval is the most frequent. (There are methods to find a mean, but we aren’t going to calculate that right now.)

In the third example, the data aren’t numbers, they’re adjectives (qualitative data). Because of this, we can find a mode, but not a mean or median.

Finding the Mode, Median and Mode of a Frequency Table

In the first table, the total frequency (the sum of the Frequency column) is 20. If we write out the data, we can see that it has a total of 36. Divide 36 by 20 and we get a mean of 1.8. We can also see that there are more 2s than any other number, so 2 is the mode. And out of 20 numbers, the 10th and 11th are in the middle: both of those numbers are 2, so the median is 2.

However, we don’t need to rewrite all the data. (And if the table were bigger, we wouldn’t want to write out all the data!) The number with the highest Frequency is 2, with a frequency of 7 (mode). If you keep a running count as you go down the Frequency column, you will see that the 9th through 15th numbers are all 2 – that includes the 10th and 11th number (median). And if we know how many of each number there are, we can take a short-cut to get the sum of the data: (0 x 3) + (1 x 5) + (2 x 7) + (3 x 4) + (4 x 0) + (5 x 1) = 36. Divide 36 by 20 and we get 1.8 (median).

In the second table, the mode and median can be found using the same method.

In the third table, because the data are descriptive and not numeric (quantitative), there is no median. A middle size somewhere between Medium and Large wouldn’t have any meaning.

Thursday, November 21, 2013

Blue Box and Whisker

(Click on the cartoon to see the full image.)

(C)Copyright 2013, C. Burke.

Eight minutes were added to Paul McGann's time.

For the non-geeks and geeks of a different calling, the numbers above represent the about of hours each actor starred as The Doctor in BBC's Doctor Who, which premeired 50 years ago. It had a 16-year hiatus, but came back in 2005, not as a reboot (I hate those) but as a continuation of the original. The numbers have been rounded to the nearest tenth of an hour, and do not, as far as I know, include later appearances in the series with other Doctors.

Paul McGann appeared on screen for only a 2-hour TV movie, intended as a pilot for a new series. (Eric Roberts played the Master.) It didn't get picked up. However, I included his recent Internet mini-episode, approximately eight minutes in length, because it's just that cool. Go watch it.

Finally: You don't have to write. I did the math. Despite his short TV tenure as The Doctor, 1.2 hours is NOT really an outlier. But it's not as funny the other way, and the back-up joke was too complicated. So you can save your Anonymous corrections. In this case, Math bows down to Humor. And I think it's "Fantastic" or even "Brilliant".


Friday, August 09, 2013

Quartiles

(Click on the cartoon to see the full image.)
(C)Copyright 2013, C. Burke.

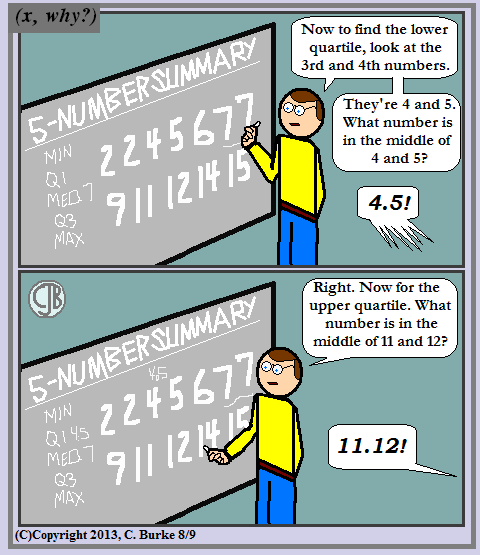
To be fair, only one student shouted that. I pretended not to hear it.